Just a Spoonful of Capacity Cuts the Wait Time in HALF!
Prefer to watch rather than read? Just click here, under 5 mins with captions.
In office work the queue doesn’t snake out the door. Its piles up emotionally in the form of the ever-expanding Inbox, and the increasing rates of friendly-but-scary “where’s my thing?” It feels like there’s no way out….but it turns out just a spoonful of capacity goes a long way.
It can halve the wait time!
Here’s how.
If you don’t work on technology development, you haven’t heard of Don Reinertsen. He’s a guru, and his book Flow: Principles of Product Development is gold if you don’t mind a bit of unique structure.
What I’m describing here is well known intuitively to call-centres and the like that have day-to-day demand, but we can miss that the same principles can apply to individuals and teams responding to ongoing Inbox-demand.
We start with a graph:
where the vertical axis is how long someone has to wait for their thing and the horizontal axis is how much space/time/capacity the team might have available.
It’s obvious that if a team is sitting around waiting for someone to email them with work, then the wait time will be zero. Then another person, and another person emails in work. The question to ask yourself is “what shape would the line be showing the relationship between how busy we are, and how long people have to wait”?
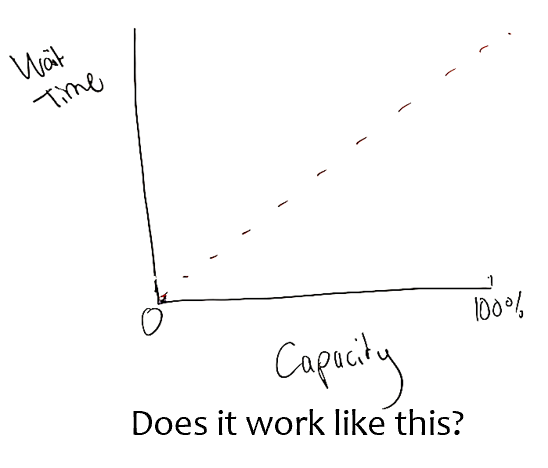
If you’re like most people, you probably imagined this:
Which shows that the less capacity (the busier we are) available, the longer the wait-time and these are in proportion.
Here’s the fun part.
The actual graph looks like this:
which is a relationship where, it’s all good for the first few that ask us to do stuff…but after a while, the amount of wait time rapidly heads for the stratosphere.
And I’m guessing this feels pretty familiar.
Now let’s put in some numbers:
We are going to say the current turnaround time for someone sending our team some work is 10 days. You’ll see the line dotted across to our capacity which we will say is pretty much at 100%. Flat out all the time.
And now we’re told to HALVE our wait time!
If we go on the first thinking, where the subconscious graph looks like this:
then we will assume halving the wait time requires us to double the capacity. So if we have a team of 5, we now need to make it a team of 10. We all know the chances of getting budget to double the team…so we forget about it and hang on in quiet desperation.
But now let’s apply the way the maths really works, which looks like this:
See the wait time going down by half on the vertical access – from 10 to 5? Now see the line tracing across to the curve and go down to the horizontal access. While there is fancy maths that can work out exactly the amount, the principle is what you see – a little bit of extra capacity goes a long way!
In fact, just a spoonful of capacity helps the wait time HALF!
And this fundamentally changes our question!
We are no longer thinking “how on earth do we get the budget for double the team?”. The question becomes
“What can we do so each of us could have 10% more capacity”? With that being the question, answers can start to flow, such as:
- Pat can’t do the harder requests, but they can handle the simple ones, let’s see if she can swing across to the team when the queue gets long to get it back down
- If we can reduce interruptions, the extra focus will give us 10% more capacity.
- Let’s review the last month’s work, there will be at least 10% of it that didn’t need to come to us at all
- Let’s see how many questions come to us just finding out where things are up to, and work out ways to make them stop
The above are just four, but with the objective being to find 10% more space instead of doubling the team…it moves from impossible to possible…and the human mind can’t help but find ways to get things done.
We just need to reframe our problem, and the graph in Reinertsen’s book gives us a great way to do it.
Just a spoonful of capacity can cut the queue in HALF!
Now…over to you, Mary Poppins!


